Dashboarding

Monitoring, and Why It Matters To You.

I’ve done a few articles on Application Insights – (older ones here and here) – but none yet on Operations Management Suite, because 1) I’m not IT in my background and 2) I’m busy leave me the heck alone! (I kid, we’ll get to it eventually.) These have all been more how-to – and admittedly it’s so easy I hesitate to call it that – versus why to. But last night on a plane coming back from Kansas City, I was mulling this over. (It helps that I had the excellent if somewhat clunky “The Art of Monitoring” on my Kindle.)

Monitoring has long been the secret sauce of DevOps. How else do we get feedback on our priorities, and actual metrics – not guesses – on which features are in use? What’s often overlooked though is that it can actually help you fight back against the wrong kind of change management – one that increases your bureaucratic workload and actually makes your build riskier and harder to fix. How is that possible?

The Blame Game

Let’s start with some basic negative cycles we’ve all seen when there’s very visible production outages. When bad things happen in production, we immediately start seeing the oddest thing happen – the SDLC process starts to dissolve into this negative cycle of blame and recriminations.

Take the example of Knight Capital in 2012. My good friend Donovan Brown often cites this as a warning example. Here, one messy 15 minute deployment led to 440M loss. In the wake of a disaster like this, John Allspaw noted that there are two counterfactual narratives that spring up:

  1. Blame change control. “Hey, better CM practices could have prevented this!”
  2. Blame testing – “If we had better QA, we at least could have taken steps to detect it faster and recover!”

It’s hard to argue with either of these. And it’s true, the RIGHT kind of change controls do need to be implemented. But by clenching like this, as Gene Kim has noted in The DevOps Handbook, “in environments with low-trust, command and control cultures, the outcomes of their change control and testing countermeasures end up hurting more than they help. Builds become bigger, less frequent and more risky.” Why is this?

This is because the devs/QA team begins implementing increasingly more clunky testing suites that take longer to execute, or writing unit tests that frequently don’t catch errors in the user experience. In a pinch, the QA team begins adding a significant amount of manual smoketesting versus automated tests. Management begins imposing long and mandatory change control boards every week to approve releases and go over introduced defects from the previous week(s) – I’ve seen these groups grow into the 100’s, most of whom are very far removed from the application. More controls, remote gatekeepers and a manual approval process leads to increased batch sizes and deployment lead times – which reduces our chances of a successful deployment for both dev and Ops. Our feedback loop – the times stretch out, reducing its value. A key finding of several studies is that high performing orgs relied more on peer review and less on external approval of changes. The more orgs rely on change approval, the worse their IT performance in both stability (MTTR and change fail rate) and throughput (deployment lead times and frequency).

This is often where I tell the story of my dad and I, trying to cut down a few trees for my uncle that had fallen across a local creek in NW Washington in a storm. The river had risen several feet and we city boys were standing below the dam formed by these large tree trunks. I remember looking up at the water swelling and pushing against the trees, as we were cutting into them, and thinking what those several feet of water would do once released. It didn’t take a lot of imagination to picture the outcome – two idiots being swept out to the Pacific Ocean – but the problem was my uncle was standing a few dozen feet away, hand on his hips, watching us with his lips tight in a disapproving line. I told my father, “Dad, I don’t care what it takes, but we need to find a way of breaking that chainsaw!” That’s the kind of backlog that can form that can choke your release cycle, reducing flow and increasing build sizes and risk. (And, by accidentally dunking the chainsaw, we were able to successfully kill the project and earn the lasting contempt of my uncle – “I want to thank you boys – it’s been a long time since I’ve been to the circus!”)

Telemetry To The Rescue

The main issue above is that this overreactive organization was trying to prevent errors and bugs from happening. Sometimes, they even call their recap (punitive!) meetings “Zero Defect Meetings” – as if such a kind of operational perfection is attainable! In contrast, DevOps savvy companies don’t try to focus on MTBF – reducing their failure count. They know outages are going to happen. Instead, they try to treat each failure as an opportunity – what test was missing that could have caught this, what gap in our processes can address this next time? Especially they focus on improving their REACTION time – improving their time to recovery, MTTR (Mean Time to Recover). Testing and automated instrumentation – that famous passage about wanting “cattle not pets”, i.e. blowing away and recreating environments at whim – forms the heart of their adaptive, flexible response strategy.

Puppet Labs – in their excellent 2014 “State of DevOps” report – mentioned that organizations that want to improve on their reaction time (MTTR) benefit the most – and it’s not even close, by an order of magnitude – from two technical tools/approaches:

  • Use of version control for all production artifacts – When an error is identified in production, you can quickly either redeploy the last good state or fix the problem and roll forward, reducing the time to recover.
  • Monitoring system and application healthLogging and monitoring systems make it easy to detect failures and identify the events that contributed to them. Proactive monitoring of system health based on threshold and rate-of-change warnings enables us to preemptively detect and mitigate problems.

We’re going to talk about monitoring above. How can monitoring help turn the tide for us so we don’t overreact because of a production outage?

So above we can see a few fixes that can transform that reactive, vicious cycle into a responsive but measured virtuous cycle that addresses the core problems you’re seeing in PROD. Some are nontechnical or more process related than anything else – and note that fixing the issue starts with purity of code – as early in the process as possible:

  1. Adding or strengthening production telemetry (we can confirm if a fix works – and autodetect next time)
  2. Devs begin pushing code to prod (I can quickly see what’s broken and make decisions to rollback vs patch). Note on this, a rollback – going to a previous version – is almost always easier and less risky. But sometimes fixing forward and rolling out a change using your deployment process is the best way forward.)
  3. Peer reviews. This includes not just code deployments but ops/IT changes to environments! (remember the Phoenix project, 80% of our issues caused by unauthorized changes, often by IT to environments, 80% of our time stuck figuring out what in this soup of changes caused the issue – before we even lift a finger to resolve anything! I’ll write more about how to do a productive peer review – expecially pair programming, which is really a code review on programming – later.)
  4. Better automated testing (again, more on this later. Look at Jez Humble’s excellent Continuous Delivery or Agile Testing for more on this.
  5. Batch sizes get smaller. The secret to smooth and continuous flow is making small, frequent changes.

A key driver here though is information radiators- a term that actually comes from Toyota’s Lean principles. This creates a feedback loop, which broadcasts back issues as quickly as possible, radiating information out on how things are going.

Etsy – just to take one company as an example – takes monitoring so seriously that some of their architects have been quoted as saying their monitoring systems need to be more available and scalable than the systems they’re monitoring. One of their engineers was quoted as saying, “If Engineering at Etsy has a religion, it’s the Church of Graphs. If it moves, we track it. Sometimes we’ll draw a graph of something that isn’t moving yet, just in case it decides to make a run for it. Tracking everything is the key to moving fast, but the only way to do it is to make tracking anything easy. We enable engineers to track what they need to track, at the drop of a hat, without requiring time-sucking configuration changes or complicated processes.”

Another great thinker in the DevOps space, Ernest Mueller, has said – “One of the first actions I take when starting in an organization is to use information radiators to communicate issues and detail the changes we are making. This is usually extremely well received by our business units, who were often left in the dark before. And for Deployment and Operations groups who must work together to deliver a service to others, we need that constant communication, information and feedback.

I know I found that being true in my career. I discovered this fairly early on in my adoption of Agile with some sportswear companies here in the Oregon region. I worked for some very personality-driven orgs with highly charged, negative dynamics between teams. As I adopted Agile, which meant broadcasting honest retrospectives – including my screw-ups and failure to meet sprint goals – I expected a Donkey Kong type response and falling hammers. The most shocking thing happened though – the more brutally honest and upfront I was on what had gone wrong, I found myself having a better relationship with the business and my IT partners. And, mistakes we made on the team were owned up to – and they typically didn’t repeat, not without the group holding the culprit (including me) responsible. That kind of “government in the sunshine” type transparency and candor was the biggest single turning point of our Agile transformation.

It’s been said, rightly, that every lie we tell ourselves comes with a payoff and a price.
I believe that very much to be the case. For developers or IT, we’ve been very used to thinking we are AWESOME and WONDERFUL and the OTHER GUYS are cowboys/bureaucratic tools and are EVIL. Maybe that story – which has the short term payoff of making us feel virtuous – comes with a heavy price, of limiting our success in rolling out easy to manage and maintain applications and delivering business value faster. By using instrumentation and telemetry, we demonstrate that we are not lying to ourselves or to our customers/the business. And suddenly a lot of those highly charged, politically sensitive meetings you find yourself in lose a lot of their subjectivity and poison – the focus is on improving numbers versus the negative punish/blame scenario.

In Closing

  • Like testing, instrumentation and monitoring seems to be a bolt on or an afterthought in every project. That’s a huge mistake. Make instrumentation and metrics the backbone of your DevOps movement, as it’s the only thing that will tell you if you’re making specific progress and earn you credibility in the eyes of the business.
  • Don’t let your developers tell you that it’s too hard or have it be an afterthought. It takes just a few minutes to make your release and application availability metrics available to all.
  • And if your telemetry system is difficult to implement or doesn’t collect the metrics you need, think about switching. Remember the Etsy lesson – making it easy and quick is the way to go. (which is why I really like App Insights!)


Advertisement

Application Insights, and what it can do for you…

I’m giving some presentations over the next few weeks on dashboarding – specifically using Application Insights. I thought I would write up some of the things I discovered in doing some prep research, including a full walkthrough so you can try it on your own projects.

First off, I think most of us have fooled around with Application Insights – it’s a checkbox on creating a project in Visual Studio for gosh sake. And maybe, we got frustrated with some of its limitations – “It doesn’t aggregate well! It’s not customizable!” – and gave up in frustration. Well, we may have quit on it too soon. Microsoft is quite committed to it as a tool – and from what I’ve seen, compared to its very inflexible and stale early iterations, is light years ahead of what I thought. It’s easy, painless. In short, there is no longer any excuse for not dashboarding your code.

I’ll do a followup post in a few days on WHY this is important. For now, here’s some quick steps to try playing with it yourself.

Getting Started

You may want to begin with some videos to kickstart some interest. First, here’s some good videos to set the stage – here’s a good intro video, another on app availability, and another with a little more detail on usage monitoring.

But let’s step out of the documentation for a second and let’s talk demo.


Short List of Steps

  1. Build a MVC app in Visual Studio and publish it to Azure. Give it a very specific name and publish to East US. (at least, that’s what my subscription allowed!)
  2. Enable Application Insights.
  3. Open up Application Insights.config and look at the info. This is how you do addl perf counters. (see this API doc for more)
  4. R mouse click on the project and select Application Insights. This opens up the portal. Pin it to the dashboard.
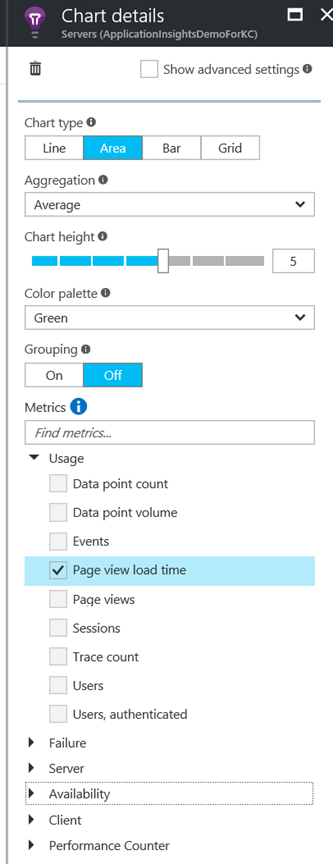
  5. Click on some items here and explore modifying the chart, etc. Look at page view load times for example.
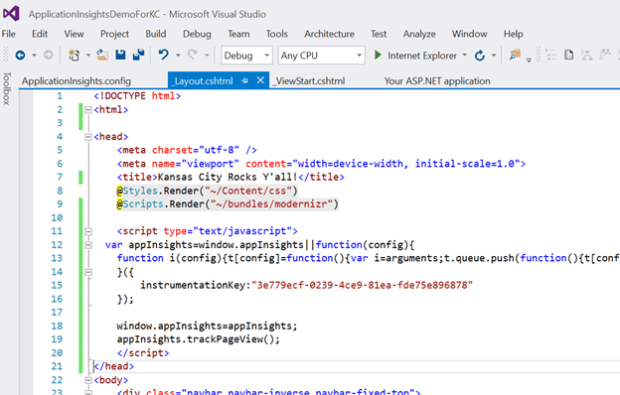
  6. Now, notice we don’t have usage data. Click on dashboard, click on Usage. Add this Js script to header on layout.cshtml. Now, when we rebuild, we’ve got actual usage times and can track it.
  7. If you wanted to do A/B testing, look at this page. Per this page, you can add tags to help segment out your errors. This can be done using either Javascript or C#/VB. This is also how you do A/B testing BTW. You put version numbers in the C#/Js. Overall in web.config
  8. Dashboard – cover:
    1. Metrics Explorer – drill down to server log telemetry
    2. Modifying charts (add Server Performance Counters)
    3. Add alerts (browser page load time)
    4. Application Map
    5. Availability (here is where you add a basic ping test every 5 minutes. Make sure you turn this off post-event!)
    6. Overview Timeline


In short, we’ll be covering MOST of the items below:

In Greater Length

Build a MVC app in Visual Studio and publish to Azure. Give it a funky name and publish to East US.

Enable Application Insights. If you have an existing app, no biggie – right mouse click on the project in Solution Explorer and enable it, then copy that single line of Javascript onto your page(s) as needed. In our case though, we’re checking the box to create the project with A.I. installed. That makes it soooo easy. And as lazy programmers – that’s what we want right?

You’ll notice there’s a very lightweight touchpoint here in your project – a few references and a new config file. Open up application insights.config and look at info:

Wow, that’s pretty easy! Check out the API I mentioned above in the short version for a list of all the goodies you can instrument/measure.

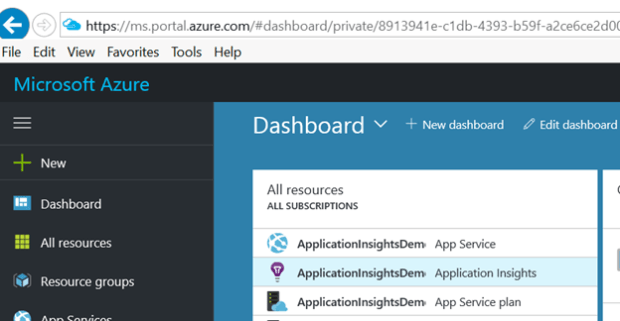
Now let’s check out our dashboard. R-mouse click on project – open up Application insights. This brings you to the Azure Portal. Notice you now have a new App Insights dashboard available to you. Go ahead and if you wish r-click to pin it to the dashboard.


Clicking on this reveals some interesting, built in instrumentation. I mean, look at all these goodies!

You can edit the chart – just click on the top right – to add some metrics that you care about.

Go to main dashboard. Notice we have no user data collection. This means we’re blind when it comes to geography/OS/browser – defining our users and the features they are liking. No biggie – clicking on the text in the chart where it says “click here to view more about usage data” or something like that – you’ll see a snippet of code available. Copy that – and let’s paste it into the _Layout.cshtml file header of our app, like so:

Per this page, you can add tags to help segment out your errors/operations. This can be done using either Javascript or C#/VB. This is also how you do A/B testing BTW. It’s extremely powerful – putting a parameter like “Version 2.1” for example. Now, you can tell when your newest version of the application is performing slower than it should for a subset of users on your production boxes. And, using deployment slots or feature toggling, you can safely kill it or fix in place without a widespread service outage.

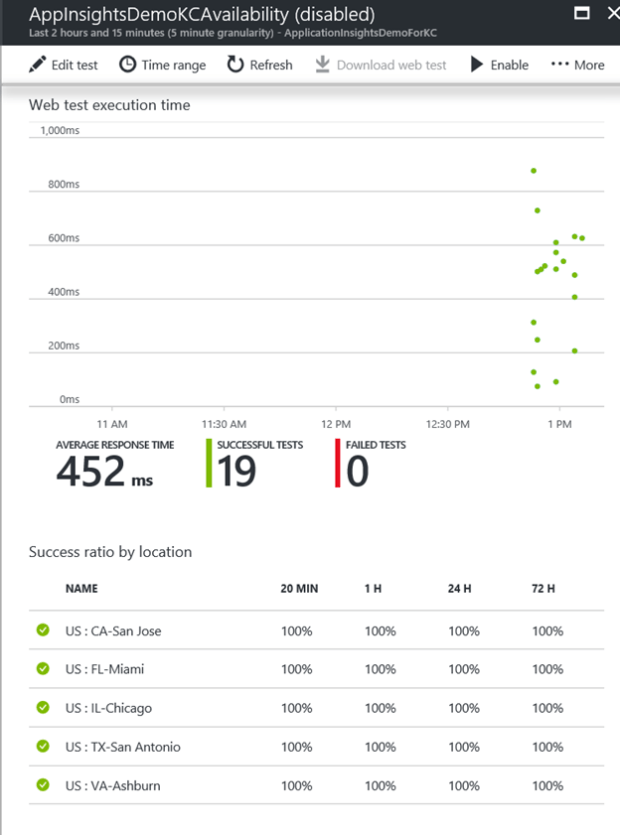
Experiment with adding a web test as well – which is really where the rubber hits the road. Now you can have different geos- Asia, N America, etc – reporting on the true end user experience. No more guesswork about how your new app is doing in Japan for example!

Note here that you may have to remove spending limits (as I had to) with web tests.

On logging – this is a simple mod to a web.config. See this page for more on this – https://docs.microsoft.com/en-us/azure/application-insights/app-insights-asp-net-trace-logs. If you use NLog, log4Net or System.Diagnostics.Trace for diagnostic tracing in your ASP.NET application, you can send your logs to Application Insights – which can then be merged with the other telemetry coming from your application, so that you can identify the traces associated with servicing each user request, and correlate them with other events and exception reports.

I was very impressed with how quickly Application Insights could allow me to drill down to a particular event for example. Check this screenshot out below:


Click on Metrics Explorer. Experiment with drilling through to stack trace of event logs, adding tags.

Notice how sweet and easy it is to add alerts. Now I can finetune my alerts so they’re actually sending me valuable information – instead of it being “your dog has died” kind of dead data.

Finish editing the charts so that they are showing metrics on Usage like

  • Usage – Browser Page Load
  • Process IO Rate
  • Users


And I do love the simple, easy instrumentation that comes with web tests. Notice – this will cost you over time, so be sure to turn it off (disable) it if not in active use!


A little more detail on my web test settings, see below:

More For The Future

Azure auditing options for your custom reporting needs

Here’s the five options I’ve been able to find – so far – if you need fine-grained detail on your Azure subscription usage. (i.e. historically showing user access for security audits across multiple resource groups, etc.)


If you want a one-sentence recommendation – sorry I have to stick with “It depends”. I think you get great power with the OMS option (#2), but the PowerBI option (#3) is up and coming and very robust.


  • Option 1: Powershell Client for Azure RM. See the links below for more on this.
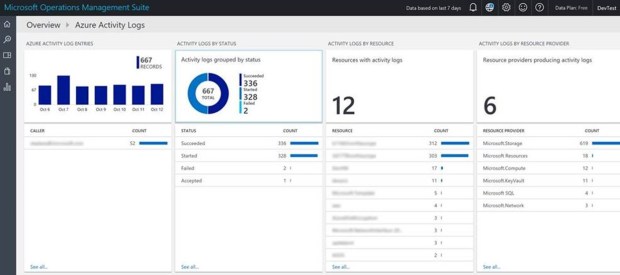
  • Option 2: Operational Insights
  • Option 3: Azure built in portal reporting
  • Option 4: PowerBI consuming the REST service. (See the links but this may very well be your best and most powerful option)
  • Option 5: Other tools consuming the ARM auditing APIs/SDK/CLI. There’s lots of log aggregation tool ranging from Excel to very sophisticated third party tooling that consumes the REST interface.


    In more detail:


    Option #1 – Powershell

    This was what we used two years ago. Nowadays, it seems like best practice is log aggregation–using Operations Management Service. That gives you the best level of customization and fine grained detail without having to take on PS scripting or consuming REST endpoints manually.


    Auditing reports using ARM Powershell, which in turn rests on the REST API we expose as part of the Azure resource manager. A Microsoft walkthrough of setup including deployment is here.


    There’s a good walkthrough on installing Powershell Client for Azure Resource Manager here. This blog goes through this in detail, including answers like ‘who accessed by subscription in the past 60 days”, “what access does a specific user have”, etc. We could extend this to show more detail points.


    There’s a walkthu on this blog of building out auditing reports. This blog uses ARM Powershell to come up with user list on subscriptions, modules used etc. And of course there’s third party products offering services in this space as well.


    The auditing APIs are evolving fast per my friends on the product team – there are some great third party tools out there that will provide this info. For you script based junkies – PS might be a great option. You can use PowerShell to view the Azure Activity Logs, showing all operations on the subscription and who did what. From here you can consume those API’s – fairly easily – and then you can crunch them into something useful.


    Start with the PS Commandlet Get-AzureRmLog:

    https://msdn.microsoft.com/en-us/library/mt603617.aspx

    https://azure.microsoft.com/en-us/documentation/articles/resource-group-audit/


    Option 2 – Operational Insights

    On #2 above, there’s an overview here of Operational Insights. A overview page on Log Analytics is here, documentation and FAQ is here, Not too much deep dive info on Operational Management Service (OMS) within Premier, but if you think this is a worthwhile option we can engage with a PFE and even build you out a pilot on it.  It can also now be connected directly to OMS (as well as Event Hubs and storage accounts). For the type of reporting you are talking about I think OMS would be the answer.


    Also worth pointing out that this is only activities carried out though ARM. If you want to see the audit records for changes to RDFE resources i.e. Classic Cloud services etc. then you still need to use the Operation Logs in the classic portal (or API). This caught me out recently trying to help a customer audit config changes to cloud services.


    Option #3 – Built in reporting in Azure

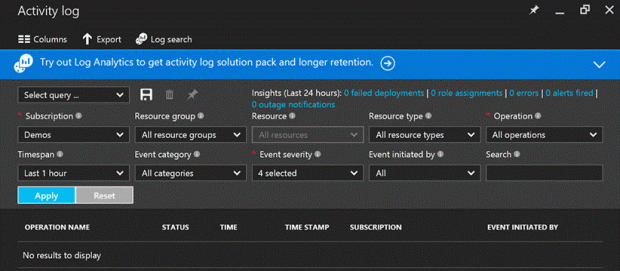
    Note that the audit data from Azure (ARM) is now available and searchable in the Azure Portal via the Activity Logs blade.


  • According to this article, there’s five different types of reporting available to subscription admins OOTB.
    • Anomaly reports – Contain sign in events that we found to be anomalous. Our goal is to make you aware of such activity and enable you to be able to make a determination about whether an event is suspicious.
    • Integrated Application reports – Provides insights into how cloud applications are being used in your organization. Azure Active Directory offers integration with thousands of cloud applications.
    • Error reports – Indicate errors that may occur when provisioning accounts to external applications.
    • User-specific reports – Display device/sign in activity data for a specific user.
    • Activity logs – Contain a record of all audited events within the last 24 hours, last 7 days, or last 30 days, as well as group activity changes, and password reset and registration activity.


    Option 4 – PowerBI

There’s a couple of slick ways to build out PowerBI reports direct from the REST endpoints. Some great references on this here.

https://azure.microsoft.com/en-us/blog/analyze-azure-audit-logs-in-powerbi-more/ – this goes through the Power BI Content Pack for Azure Audit Logs. There’s a secondary article right here with some snapshots. From this doc:

“In a nutshell, Azure Audit Logs is the go-to place to view all control plane events/logs from all Azure resources. It includes system and user generated events. You can also access this through the Azure Insights SDK, PowerShell, REST API and CLI. The logs are preserved for 90 days in Azure’s Event Logs store.”

Here’s the data you can gather:

  • Events by any particular resource over time
  • Which users perform what actions, how frequently and on what resources
  • Actions and events per subscription, resource group, region etc.
  • Azure Service Health (outages and maintenance) events that potentially impacted your resources
  • Alerts and AutoScale events by resource and time
  • Failures, success of deployments and registrations


Microsoft has further documentation explaining how you can access Azure Audit Logs in the Azure Portal.


Option 5 – Other options:

  • There’s advanced reporting available in Azure Active Directory as well. Azure Active Directory Premium. Advanced reports help you improve access security, respond to potential threats and get access to analytics on device access and application usage. There’s a walkthrough of this at this page.


I hope to add to this in the future with some great third party tooling we could recommend. Stay tuned!


Ok, we all love DevOps. But now what?

We commonly find that everyone – and I mean EVERYONE – is in favor of DevOps once they realize how great it is. Entire teams read through “Continuous Development” by Jez Humble or “The Phoenix Project” by Gene Kim and they are full of enthusiasm, ready to change their deployment processes so changes are safer and more repeatable. But then these teams have a “now what?” moment – we know we want to improve our processes, but where to start?

One of the cool things about DevOps is the lack of fuzziness – it is very, very tangible in terms of measuring ROI and tracking progress. For example, check out the very specific metrics you can use below that the thought leaders above have identified as being common traits of highly effective organizations:

  1. High service levels and availability (as measured by Mean Time To Repair – MTTR, Mean Time Between Failures or MTBF)
  2. High throughput of effective change (change success rate >99%)
  3. Tight collaboration between dev, Ops/IT, QA team, and security auditors
  4. Controls are visible, verifiable, regularly reported
  5. Low amount of unplanned work (<5% of time spent firefighting, compared to the average of 40%)
  6. Systems highly automated and hands-free
  7. Server to System Admins ratio 100:1 or greater (average is 15:1)

Those factors above are beautiful because they’re so specific, not subjective. You could – and should – publish these on a dashboard, showing your current state and tracking your maturity level improvement over time.

So, getting down to brass tacks, once we do a baseline and see where we measure up on those 7 key factors above, how do we get to “Phoenix Project” greatness?

You could tackle this in three stages, as follows:

Phase

Steps

Phase 1 – Assessment

Create a release management team

Institute weekly change management meetings

Begin gathering and publishing “7 power metrics” (above)

Inventory applications and systems, and identify business stakeholders

Phase 2 – Enforcement

Identify fragile artifacts (Martin Fowler’s infamous “snowflake servers“)

Document your policy and change window system by system with stakeholders

Remove access to all but authorized change managers

Electrify the fence with monitoring / active enforcement of policy

Phase 3 – Stabilization

Build a library of repeatable builds

Feed change info to first responders and trouble ticket system

Kaizen (improve and expand metrics gathering, feedback to stakeholders and management)


These phases aren’t strictly done in a series – there’ll be overlap, and its definitely a monumental undertaking. But, if you love the idea of change management and reducing all the wasted time and stress you spend in firefighting in your company, rest assured – DevOps isn’t just buzz and fluff, it’s tangible and measurable. And it’s a journey that – while it has no true ending – you’ll be very glad that you took. It’ll mean a happier relationship with your business partners and customers, less time tied down in reactive troubleshooting, and more time with your loved ones and families. What’s not to love?

P.S. if you enjoyed The Phoenix Project and want to read up more on your next steps, check out “Visible Ops“. This tiny little book is 100 pages of very specific, tangible steps you can take to inject some DevOps goodness into your own IT organization.

Application Insights redux

I spent a few minutes today getting reacquainted with Application Insights. Here’s some links and walkthrus so you can have fun with it yourself. For web dashboarding, I do think it has distinct advantages over Google Analytics etc.

See this article, which – fair warning – I borrowed from pretty heavily in my experiments. You’ll need an Azure account and at least VS2013 update 3.

There’s two ways of going about sprinkling ApplicationINsights pixie dust all over your app. (And no it doesn’t have to be ASP.NET site!)

Existing Site:

  1. Create a new project (or open an existing one).
  2. R-click on project and select Add Application Insights Telemetry. This will add all the references you’ll need and add some event handlers to your startup code.

Can add App Insights Status Monitor to an existing app (NuGet?) Executes NuGet, updates web.config, and restarts.

The other fancy way is on creation. Note, adding it to your site is now the DEFAULT! Redmond won’t rest till all your dashboarding/alerts are showing up in one central place.

From your Azure Portal:

Click New, Application Insights. You can browse to your site from here as well.


Once you’re viewing the A.I. portal, try clicking on Requests or Alerts to improve your telemetry/charting.

It was embarrassing how easy it was to add availability/performance tests using this site’s walkthrough. In my case, I had the site instrumented: all I had to do was click on the webtests tile in the AppInsights dashboard to create my test:


And wait a few minutes and presto – I had to manually refresh the portal – but I get fancy-dancy availability graphics. It’s drillable and … wow to get this much out of the box is kinda amazing.


Another option is to explore adding telemetry. Click on the Diagnostic Search icon in the portal…

Which opens up a drillable, filterable list of all the telemetry on my app. Including tags.


Go ahead and click on one of those events – I just dare ya. Notice you can drill in specifically by clicking on the three ellipses below the Request Details node to view every field collected:


In this case, using the very cool Filter set to Errors showed me exactly where the issue was – database availability. It even parses log4Net or Nlog traces.Easy peasy!

I could have added custom events using JavaScript, or maybe the following C# snippet:

// Set up some properties:

var properties =
new
Dictionary
<string,
string>


{{“game”, currentGame.Name},
{“difficulty”, currentGame.Difficulty}};

var measurements =
new
Dictionary
<string,
double>


{{“Score”, currentGame.Score},
{“Opponents”, currentGame.OpponentCount}};


// Send the event:

telemetry.TrackEvent(“endOfGame”, properties, measurements);


Alternately if I wanted to throw errors – this is very powerful as you can navigate between failed requests and exceptions and read the entire exception stack – create a new page called ThrowError or the like and add the following to Page_Load – after adding a using reference to Microsoft.ApplicationInsights in the header:


var telemetry = new
TelemetryClient();


try

{


//doing some stuff here


throw
new
DivideByZeroException();


}


catch (Exception ex)

{


// Set up some properties:


var properties = new
Dictionary <string, string>

{{“appinsightsdemo”, “usernamehere”}};


var measurements = new
Dictionary <string, double>

{{“Users”, 1}};


// Send the exception telemetry:

telemetry.TrackException(ex, properties, measurements);

}

Then I build it out and try hitting that page a few times. Suddenly I get drillable exceptions:

A wonderful overall video is shown here – http://azure.microsoft.com/en-us/documentation/videos/getting-started-with-application-insights/