Month: September 2014

Debugging Windows applications – my walkthrough path

Recently faced an issue where a client had a memory allocation issue on one of their servers. I’m not going to deep dive into any of these, but here were some of the tools I used in tracking down the culprit:

  1. Go through Eventvwr and look at any error messages. There’s a list of error codes on MSDN.
  2. Get a process dump (full please!) using procdump. Configure with –ma –x to capture a dump on failure.
  3. In Windbg, open the crash dump and use !analyze –v. There’s an extensive set of help files on windbg.
  4. DebugDiag for crash analysis, slow performance, memory leak analysis, and performance analysis.
  5. ApplicationVerifier (appverif.exe) – for subtle programming errors. (i.e. heap corruption, incorrect handles). Since this must be run client-side, more of a dev than a production tool. This doesn’t require a process dump.
  6. Perhaps look at a self dump generation in code.
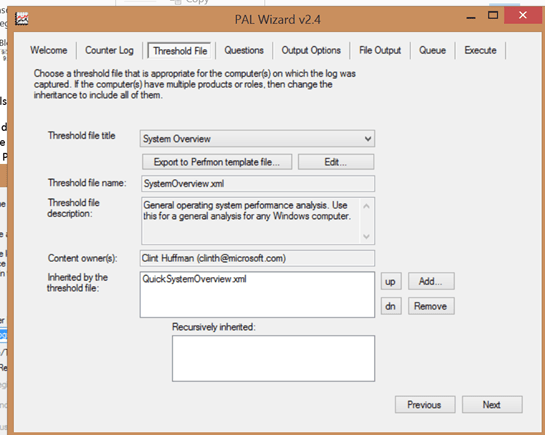
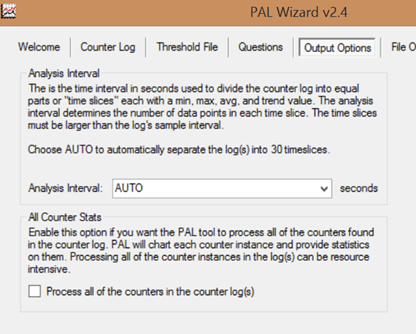
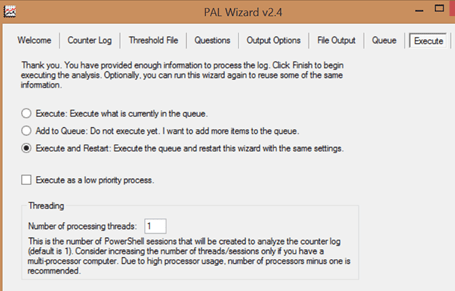
  7. Perfmon/PAL to look at memory leaks. This is for growing heaps (where memory is allocated but not deallocated), handle leaks (handles are created but not freed), and rising thread count. Memory allocation issues are very troublesome to catch and there’s a ton of third party tools out there to help – think RationalPurifier or Insure++.


In a little more detail:

  • For a crash:
    • Windbg debugger is xcopy deployable.
    • DebugDiag runs as a service, and monitors the process – if it crashes, it creates a dump.
    • Adplus – this is a command line tool you can set with –crash –p{processID}
  • For a hung process:
    • Task Manager (right mouse click to create a crash dump)
    • DebugDiag (process tab, rt-mouse click, create full user dump)
    • Adplus –hang –p{pid}
  • For a memory leak:
    • CLR memory profiler
    • DebugDiag (our Swiss army knife!) – leak track, rule and user dump
    • Umdh (old school – command line)
    • For .NET, there’s sos.dll and psscor4.dll – these are debugger extensions to analyze .NET dump stacks.
Advertisement

Perfmon and PAL notes

PAL is a tool (available on CodePlex –it’s open source) that generates an HTML report that charts performance counters generated from PerfMon and throws alerts when they’re exceeded. We’re not talking about anything obtrusive here – just a little VBScript GUI on top of Powershell to generate a nice-looking graphical UI. Its really sweet and can save you a ton of time in figuring out what the heck is going wrong when your server isn’t working properly. I ran it this morning on my underpowered little laptop and found a lot of issues with context switching for example:

Simple Overview:

  1. Download PAL and the separate Chart Controls for .NET 3.5 and install.
  2. Open up PAL and in the Threshold File tab export a template. Go ahead and view the XML file you generate in any text editor and view the counters. See, no magic!
  3. Open up Perfmon and create a new user defined data collector set. Import the file you created in #2. Run it in perfmon for at least 10-30 minutes.
  4. Go back to PAL and select the .blg file you just generated in #3 in the Counter Log tab. Click Next and then – last tab – generate your awesome HTML file, complete with charts and RYG indicators.


Long and Boring:

To run these tools, use the following steps:

  1. Download PAL from CodePlex and run the MSI package.
  2. Install the Chart Controls for .NET Framework 3.5 – there’s a link in the main codeplex page here.
  3. Now run PAL. Choose the default template:


    All done with that? Good.


    In the Threshold File page notice the long list of threshold files you can choose from – anything from BizTalk to System Overview (good if you have no specific match) to ASP.NET to SQL Server 2008R2 etc. BEFORE you do this go to the Questions tab and make sure its set properly for your OS/# of CPU’s / available memory etc. Then go back to Threshold and select Export to Perfmon Template File.


    And click on the Export to Perfmon template file and enter a nice-sounding name to create a perfmon profile template (BLG) onto your desktop. You’ll be using this next.


  4. Now open up Perfmon and expand the Data Collector Sets node, and select User Defined, and create a new data set.

Give it a name:

You’ll see the following – use the Browse button to select your template:

… and run it. Give it a healthy 10 minutes or even longer – you won’t stress your system. Then reenter PAL.


The tab above is worth a mention. Just select AUTO. You really don’t want to have it as more than that – a little too coarse of a grain to capture issues there – and anything less is WAY too fine. Trust me, with the number of counters we’re capturing, even with a very modest set it took PAL almost 12 minutes to finish compiling its report. 30 seconds is fine!


Everything else leave as is. I like to set the PAL tool so it Executes and Restarts:


There’s volumes of information here – a wealth of diagnostic information. Best part is, there’s KB links right there to point you to where to go. No more wondering what counters to pick, or what the values mean – it’s there and displayed, over time, in an easy to digest format. You can run perfmon just fine on any production environment with one caveat – BE CAREFUL about the length of time you’re running perfmon, usually 10-30 minutes is fine, although I’ve run it overnight – and don’t change it to something crazy like every second or something. Use the AUTO setting (which is 30 seconds). Changing this value to something unreasonable can bottom out your servers in no time flat, and makes root cause analysis harder.

There’s another tool out there called Server Performance Advisor – it analyzes both perfmon logs and Event Tracing for Windows. It’s best for analyzing short term performance problems; PAL is best for covering long periods of time.


Helpful links:

Give Yourself Nine Months to Fail.

(Note – this is a Greatest Hits posting from my previous blog. Enjoy!)

Babies aren’t born in one month.

Implementing Scrum Means Making Mistakes. Lots and Lots of Mistakes.

When I started on at my current employer – even after nine months as a team lead – I had very little to boast about by way of making change. I remember hearing a presentation from another manager that had the title, “Keeping The Lights On” – WOW! – And honestly that was how I felt about my job. Keeping the lights on, reacting to events – not getting ahead of them, and not able to control them. I was very disconnected from the work my team was doing. This changed as we moved out developers that were not contributing to the team and not being transparent about their work; and, as we got new projects coming in, I could cherrypick the fun ones and start participating in writing specfications and deploying solutions. Beyond taking on new work, though, Agile is the biggest reason why I’m still around. Without it, I’d be like the manager at my previous company – completely isolated from the daily work my team is doing, trying to defend our existence without the facts I need to prove that we’re delivering value.

I started thinking about my company – which seems to love mountains – and how every company’s definition of Agile is a little different. At the keynote I met an old compatriot – we had worked on a project together that was a failed Agile project. Everyone hated the DSU’s, which were 15+ minutes long, there was no target in sight since releases were pushed out to “never”, we went through constant rewrites as the technical team constantly refactored working code to get it “perfect”… it was a case study in how to do Agile wrong. After 18 months of development, they had to scrap the entire project and outsourced it to an offshore team – not one line of code ever saw the light of day. I believe a big reason why we failed was, we tried to change everything at once – and the team never gelled or considered itself invested in the outcome. In contrast, almost by accident, by doing things step by step – and rolling back when things weren’t working – we were successful in my current assignment. The path below took almost two years to implement, step by step – but it was done with the team setting the pace, and almost by accident we reached our goals.

I started out by talking about the fears I felt after a few months on the job. Overwhelmed, disconnected. I said, “I feel at times like I wasn’t as much in control as I need to be. I wasn’t in command of all the facts I need to support my case. I didn’t have enough visibility of what’s going on across the organization. I wasn’t giving my team all the tools and resources they need to thrive. And I wasn’t providing enough proof of delivering value aligned with what my company’s priorities are.”

Being busy is a form of laziness??!

So I had a friend recommend “The 4-Hour Workweek” by Timothy Ferriss. It’s not your typical business book, and I like how he gets down to the essentials. (I think he’s a little materialistic but there it is.)

Here’s some points that made me think:

  • Being busy is a form of laziness – lazy thinking and indiscriminate actions. It’s a failure to set priorities.
  • The 80/20 rule – Limit tasks to the important to shorten work time.
  • Parkinsons law (tasks expand to fill the time allotted) – Shorten work time to limit tasks to the most important.
  • You should have, at most, 2 goals or tasks to do each day – and you should drive them through to completion.

So what am I going to try as a result of reading this book?

  • I’m going to go on an information diet. I’m always multitasking, walking around with a book in my hand, and never giving anything – or anyone – the attention they need. It sends the wrong message and contributes to a feeling of being overwhelmed by events – instead of in command of them. So, for 1 week, I’m swearing off newssites, TV, and even reading books (except for one hour in the evening). No web surfing except for what’s necessary for work.
  • Three times a day I’m going to ask myself – Am I being productive or just active? Am I inventing things to avoid the important?
  • I’m going to try to keep M/F as free of work as possible and use it to up my skillset.
  • I’m going to be setting my priorities every morning using Outlook calendar – but not checking my email. That’s for 1 p.m. and 4 p.m. Checking email first thing in the morning is the worst thing you can do to start your day.