PAL is a tool (available on CodePlex –it’s open source) that generates an HTML report that charts performance counters generated from PerfMon and throws alerts when they’re exceeded. We’re not talking about anything obtrusive here – just a little VBScript GUI on top of Powershell to generate a nice-looking graphical UI. Its really sweet and can save you a ton of time in figuring out what the heck is going wrong when your server isn’t working properly. I ran it this morning on my underpowered little laptop and found a lot of issues with context switching for example:

Simple Overview:
- Download PAL and the separate Chart Controls for .NET 3.5 and install.
- Open up PAL and in the Threshold File tab export a template. Go ahead and view the XML file you generate in any text editor and view the counters. See, no magic!
- Open up Perfmon and create a new user defined data collector set. Import the file you created in #2. Run it in perfmon for at least 10-30 minutes.
- Go back to PAL and select the .blg file you just generated in #3 in the Counter Log tab. Click Next and then – last tab – generate your awesome HTML file, complete with charts and RYG indicators.
Long and Boring:
To run these tools, use the following steps:
- Download PAL from CodePlex and run the MSI package.
- Install the Chart Controls for .NET Framework 3.5 – there’s a link in the main codeplex page here.
-
Now run PAL. Choose the default template:

All done with that? Good.
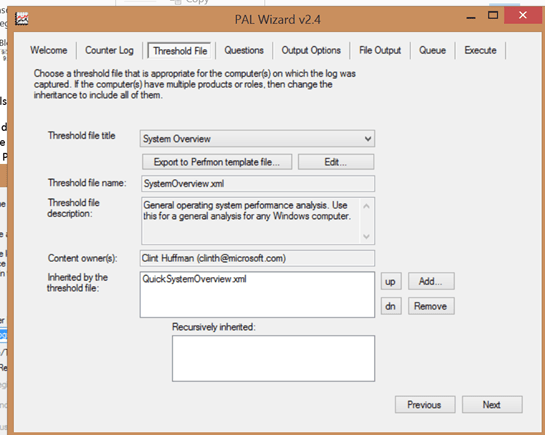
In the Threshold File page notice the long list of threshold files you can choose from – anything from BizTalk to System Overview (good if you have no specific match) to ASP.NET to SQL Server 2008R2 etc. BEFORE you do this go to the Questions tab and make sure its set properly for your OS/# of CPU’s / available memory etc. Then go back to Threshold and select Export to Perfmon Template File.

And click on the Export to Perfmon template file and enter a nice-sounding name to create a perfmon profile template (BLG) onto your desktop. You’ll be using this next.
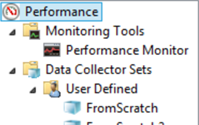
- Now open up Perfmon and expand the Data Collector Sets node, and select User Defined, and create a new data set.

Give it a name:

You’ll see the following – use the Browse button to select your template:

… and run it. Give it a healthy 10 minutes or even longer – you won’t stress your system. Then reenter PAL.

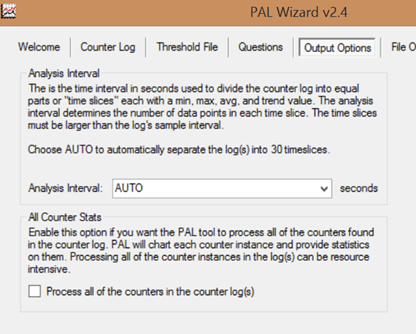
The tab above is worth a mention. Just select AUTO. You really don’t want to have it as more than that – a little too coarse of a grain to capture issues there – and anything less is WAY too fine. Trust me, with the number of counters we’re capturing, even with a very modest set it took PAL almost 12 minutes to finish compiling its report. 30 seconds is fine!
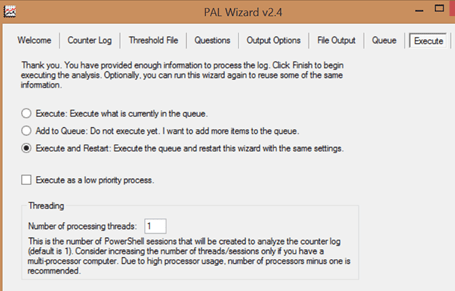
Everything else leave as is. I like to set the PAL tool so it Executes and Restarts:

There’s volumes of information here – a wealth of diagnostic information. Best part is, there’s KB links right there to point you to where to go. No more wondering what counters to pick, or what the values mean – it’s there and displayed, over time, in an easy to digest format. You can run perfmon just fine on any production environment with one caveat – BE CAREFUL about the length of time you’re running perfmon, usually 10-30 minutes is fine, although I’ve run it overnight – and don’t change it to something crazy like every second or something. Use the AUTO setting (which is 30 seconds). Changing this value to something unreasonable can bottom out your servers in no time flat, and makes root cause analysis harder.
There’s another tool out there called Server Performance Advisor – it analyzes both perfmon logs and Event Tracing for Windows. It’s best for analyzing short term performance problems; PAL is best for covering long periods of time.
Helpful links:


