I’m giving some presentations over the next few weeks on dashboarding – specifically using Application Insights. I thought I would write up some of the things I discovered in doing some prep research, including a full walkthrough so you can try it on your own projects.
First off, I think most of us have fooled around with Application Insights – it’s a checkbox on creating a project in Visual Studio for gosh sake. And maybe, we got frustrated with some of its limitations – “It doesn’t aggregate well! It’s not customizable!” – and gave up in frustration. Well, we may have quit on it too soon. Microsoft is quite committed to it as a tool – and from what I’ve seen, compared to its very inflexible and stale early iterations, is light years ahead of what I thought. It’s easy, painless. In short, there is no longer any excuse for not dashboarding your code.
I’ll do a followup post in a few days on WHY this is important. For now, here’s some quick steps to try playing with it yourself.
Getting Started
You may want to begin with some videos to kickstart some interest. First, here’s some good videos to set the stage – here’s a good intro video, another on app availability, and another with a little more detail on usage monitoring.
But let’s step out of the documentation for a second and let’s talk demo.
Short List of Steps
- Build a MVC app in Visual Studio and publish it to Azure. Give it a very specific name and publish to East US. (at least, that’s what my subscription allowed!)
- Enable Application Insights.
- Open up Application Insights.config and look at the info. This is how you do addl perf counters. (see this API doc for more)
- R mouse click on the project and select Application Insights. This opens up the portal. Pin it to the dashboard.
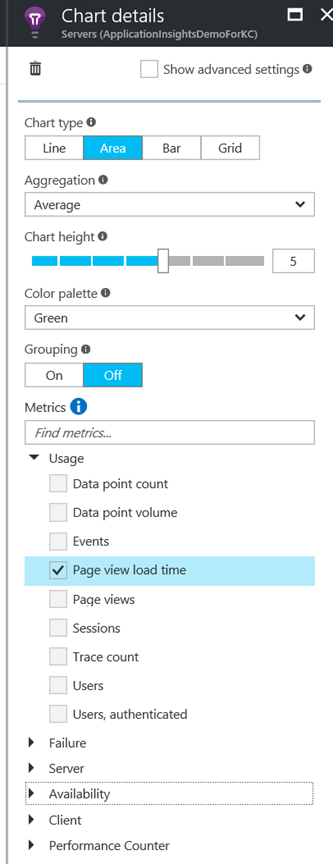
- Click on some items here and explore modifying the chart, etc. Look at page view load times for example.
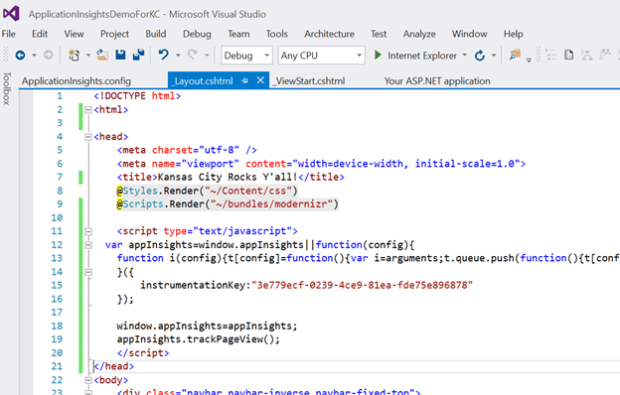
- Now, notice we don’t have usage data. Click on dashboard, click on Usage. Add this Js script to header on layout.cshtml. Now, when we rebuild, we’ve got actual usage times and can track it.
- If you wanted to do A/B testing, look at this page. Per this page, you can add tags to help segment out your errors. This can be done using either Javascript or C#/VB. This is also how you do A/B testing BTW. You put version numbers in the C#/Js. Overall in web.config
-
Dashboard – cover:
- Metrics Explorer – drill down to server log telemetry
- Modifying charts (add Server Performance Counters)
- Add alerts (browser page load time)
- Application Map
- Availability (here is where you add a basic ping test every 5 minutes. Make sure you turn this off post-event!)
- Overview Timeline
In short, we’ll be covering MOST of the items below:

In Greater Length
Build a MVC app in Visual Studio and publish to Azure. Give it a funky name and publish to East US.
Enable Application Insights. If you have an existing app, no biggie – right mouse click on the project in Solution Explorer and enable it, then copy that single line of Javascript onto your page(s) as needed. In our case though, we’re checking the box to create the project with A.I. installed. That makes it soooo easy. And as lazy programmers – that’s what we want right?
You’ll notice there’s a very lightweight touchpoint here in your project – a few references and a new config file. Open up application insights.config and look at info:

Wow, that’s pretty easy! Check out the API I mentioned above in the short version for a list of all the goodies you can instrument/measure.
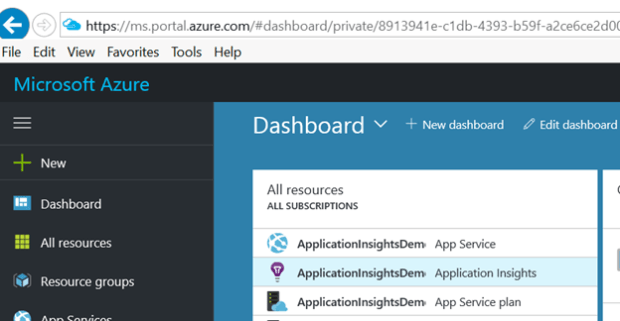
Now let’s check out our dashboard. R-mouse click on project – open up Application insights. This brings you to the Azure Portal. Notice you now have a new App Insights dashboard available to you. Go ahead and if you wish r-click to pin it to the dashboard.
Clicking on this reveals some interesting, built in instrumentation. I mean, look at all these goodies!

You can edit the chart – just click on the top right – to add some metrics that you care about.
Go to main dashboard. Notice we have no user data collection. This means we’re blind when it comes to geography/OS/browser – defining our users and the features they are liking. No biggie – clicking on the text in the chart where it says “click here to view more about usage data” or something like that – you’ll see a snippet of code available. Copy that – and let’s paste it into the _Layout.cshtml file header of our app, like so:
Per this page, you can add tags to help segment out your errors/operations. This can be done using either Javascript or C#/VB. This is also how you do A/B testing BTW. It’s extremely powerful – putting a parameter like “Version 2.1” for example. Now, you can tell when your newest version of the application is performing slower than it should for a subset of users on your production boxes. And, using deployment slots or feature toggling, you can safely kill it or fix in place without a widespread service outage.
Experiment with adding a web test as well – which is really where the rubber hits the road. Now you can have different geos- Asia, N America, etc – reporting on the true end user experience. No more guesswork about how your new app is doing in Japan for example!
Note here that you may have to remove spending limits (as I had to) with web tests.
On logging – this is a simple mod to a web.config. See this page for more on this – https://docs.microsoft.com/en-us/azure/application-insights/app-insights-asp-net-trace-logs. If you use NLog, log4Net or System.Diagnostics.Trace for diagnostic tracing in your ASP.NET application, you can send your logs to Application Insights – which can then be merged with the other telemetry coming from your application, so that you can identify the traces associated with servicing each user request, and correlate them with other events and exception reports.
I was very impressed with how quickly Application Insights could allow me to drill down to a particular event for example. Check this screenshot out below:

Click on Metrics Explorer. Experiment with drilling through to stack trace of event logs, adding tags.
Notice how sweet and easy it is to add alerts. Now I can finetune my alerts so they’re actually sending me valuable information – instead of it being “your dog has died” kind of dead data.
Finish editing the charts so that they are showing metrics on Usage like
- Usage – Browser Page Load
- Process IO Rate
- Users

And I do love the simple, easy instrumentation that comes with web tests. Notice – this will cost you over time, so be sure to turn it off (disable) it if not in active use!
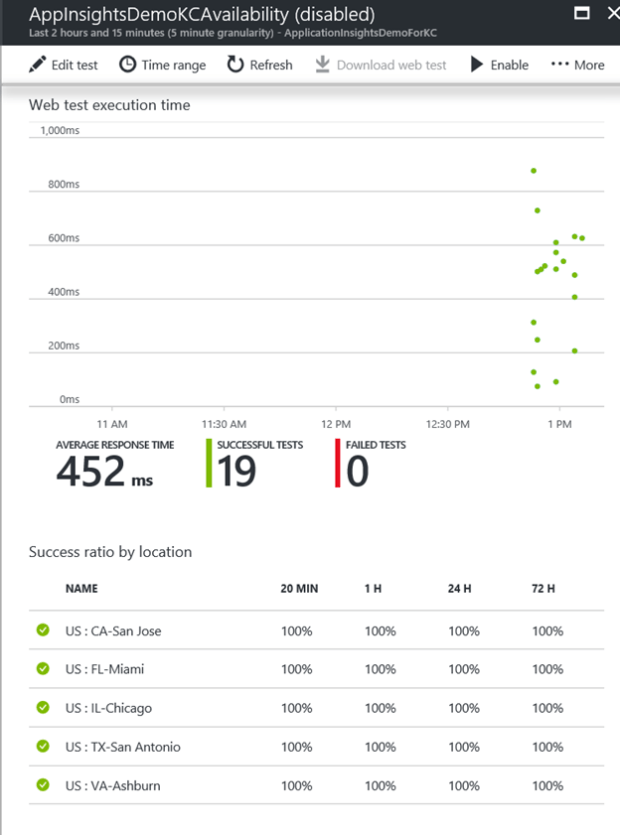
A little more detail on my web test settings, see below:

More For The Future
- See this YouTube video for live metrics collection., https://www.youtube.com/watch?v=hIya4UW1kAw
- An article on Search is here. I haven’t had a chance to explore it much. https://docs.microsoft.com/en-us/azure/application-insights/app-insights-diagnostic-search
- And, I have more to think about down the road. I really want to try Log4Net and see how its improved, and maybe Splunk. And I’d like to kick New Relic’s tires and see how it stacks up to Application Insights.
