In-Memory OLTP is WAY, way cool. NoSQL for the masses!

I’m still playing around with In-Memory OLTP on SQL Server 2014. Already I’m impressed. It seems to be the default way, when I’m writing BI solutions in the future – or transactional systems where there’s a ton of locking issues – to magically resolve contention issues and dramatically improve throughput and performance. We’re talking 5-10x performance gains – for little or no cost in terms of redesign. With sprocs, we’re seeing sometimes 10-30x improvement. Awesome!

Use Case Scenarios

Folks, this new feature is meant for where there’s a lot of contention issues. If you have a data warehouse or where the database is highly structured, it may not be a good fit. In tables where there are a lot of singleton type actions – an atomic relationship – it’s a natural.

The thing to keep in mind is that Hadoop/NoSQL doesn’t fit every scenario. NoSQL is not meant as a replacement for OLTP and has inherent latency issues.

If you want to scale up efficiently, you need to handle transactional and machine-generated data efficiently. You can now buy a 50-core machine with 500GB of memory for 50K – chump change really – and memory is scaling up to terabyte range. CPU, because of inherent heat issues in processing, has stalled out in comparison. So if we’re going to see improvements in SQL performance It has to be in the one area that has really kicked off in the past decade – memory. Frankly speaking, the rules that were in place when SQL Server 7/2000 and above were written no longer apply when we’re talking about a TB or so of memory. The old rules assumed all pages required a potential read from the disk – but today’s lower-cost memory means we need a new costing algorithm. Waits for log writes, latch availability and lock releases can be ignored or minimized.

And, I found it very transparent. You’re managing memory in the same space, and the change is nearly painless. Just some modest changes to the primary key and some db settings, and I was good to go. For example, check out the snapshot below. Half of them are in-memory, half aren’t. Can you tell the difference? I can’t.

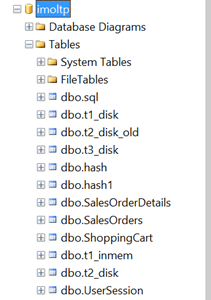
Table/indexes are now only in-memory – this is stream-based storage. It’s lock and latch-free, with no runtime compilation of sprocs – sprocs and BL are all natively compiled, meaning a huge performance gain.

Migration Path

It isn’t just moving indexed tables to memory. And it isn’t just pinning the table in the buffer pool (i.e. the venerable and now deprecated DBCC PINTABLE). There will be some changes you’ll have to make to your table structure in handling a migration. This has been described as being NOSQL for SQL Server – without having to dip into the bowels of MapReduce algorithms.

Some things to keep in mind:

  • You will have to make some changes to your database structure to get in-memory OLTP working for you.
  • Data is (or can be) durable and highly available – meaning you won’t lose data after a server crash.
  • Row-based structure – forget about table/index structures as we know it today. A row is an atomic thing. There’s no such concept with a page as you get with an on-disk engine. Rows are versioned and there is no in-place updates. (!)
  • You can create a non-durable table with the data being transient using the SCHEMA_ONLY attribute. (Think for Staging tables or for managing session state).
  • You must have at least one index. There’s two types of indexes – nonclustered hash index (good for point lookups) or memory optimized nonclustered index (for ranges). Engine removes lock/latch concurrent. We’ve seen much reduced bandwidth in the transaction log, latency does remain.
  • One big issue for me – Entity Framework uses ad hoc queries, meaning you won’t have in-memory OLTP benefits with native sprocs.
  • With transactions –
    • Declare isolation level (no locking hints)
    • Use retry logic to handle conflicts/validation failures
    • Avoid using long-runing transactions (duh)
    • Disk-based Snapshot, RepeatableRead/Serializable is not supported. SNAPSHOT, REPEATABLEREAD/SERIALIZABLE are all good. Data migration use Snapshot (for example where you use READCOMMITTED today)

Looking Before You Leap

There’s a management data warehouse where you can analyze the current application for potential migration. This will give you a quadrant view if it’s a good fit.

To run this, I right-clicked on the Management, Data Collection node in SSMS, and selected the Configure Management Data Warehouse option. After a splash screen, I selected my target imoltp database, and left the users/roles unmapped in the final screen. Lots of spinning wheels at this point while SQL Server thought things over and spun up my mdw. This gave me a nice graphical view on whether migrating my tables was a good thing. Here’s the best practices below for analyzing whether you should make the leap:

(note – above is from MSDN article here, http://msdn.microsoft.com/en-us/library/dn205133.aspx )


I recommend experimenting with this on a copy of your current database. See if you run the report – R-mouse click at the DB-level or on individual tables – if you don’t see significant benefits.

So for highly transactional systems or for data warehouses, think of this as being a solution.


References

Great article by Kalen Delany on the internals – a must-read: http://t.co/6IzfRnJLcu

A great MSDN overview: http://msdn.microsoft.com/en-us/library/dn133186(v=sql.120).aspx

Some Sample Scripts To Play With


CREATE
TABLE [dbo].[t3_disk](

    [c1] [int] IDENTITY(1,1)
NOT
NULL,

    [c2] [char](100)
NOT
NULL,


CONSTRAINT [PK_t3_disk] PRIMARY
KEY
CLUSTERED

(

    [c1] ASC

)WITH (PAD_INDEX = OFF, STATISTICS_NORECOMPUTE =
OFF, IGNORE_DUP_KEY
=
OFF, ALLOW_ROW_LOCKS
=
ON, ALLOW_PAGE_LOCKS
=
ON) ON [PRIMARY]

)
ON [PRIMARY]


GO


SET
STATISTICS
TIME
OFF;

SET
NOCOUNT
ON;


— inserts – 1 at a time

DECLARE @starttime datetime2
=
sysdatetime();

DECLARE @timems INT;

DECLARE @rowcount INT
= 100000


— disk-based table and interpreted Transact-SQL

DECLARE @i int
= 0

DECLARE @c varchar(300)

BEGIN
TRAN

WHILE (@i <10000)

BEGIN

SET @c =
RIGHT(CAST((replicate(‘1’,100)
+
CAST(@i as
VARCHAR(300))) as
VARCHAR(300)), 100)

INSERT
INTO t3_disk VALUES(@c)

SET @i = @i + 1

END

COMMIT


SET @timems =
datediff(ms, @starttime, sysdatetime());

SELECT
‘Disk-based table insertion, 100000 records: ‘
+
CAST(@timems AS
VARCHAR(10))
+
‘ ms’;


–ok 225 ms.


— Interop Hash

— for bucket size see this article – http://msdn.microsoft.com/en-us/library/dn494956.aspx

–in general you want the bucket size to be between 1-2x the size of the number of unique values in the index


USE [imoltp]

GO

SET
ANSI_PADDING
ON

DROP
TABLE dbo.t3_inmem


CREATE
TABLE [dbo].[t3_inmem]

(

    [c1] int
IDENTITY(1,1)
NOT
NULL PRIMARY

KEY
NONCLUSTERED
HASH
WITH (BUCKET_COUNT=20000),

    [c2] [char](100)
NOT
NULL,


–could experiment as well with PRIMARY KEY NONCLUSTERED

)WITH ( MEMORY_OPTIMIZED =
ON
,
DURABILITY
= SCHEMA_AND_DATA )


SET
STATISTICS
TIME
OFF;

SET
NOCOUNT
ON;


— inserts – 1 at a time

DECLARE @starttime datetime2
=
sysdatetime();

DECLARE @timems INT;

DECLARE @rowcount INT
= 100000


DECLARE @i int
= 0

DECLARE @c varchar(300)

BEGIN
TRAN

WHILE (@i <10000)

BEGIN

SET @c =
RIGHT(CAST((replicate(‘1’,100)
+
CAST(@i as
VARCHAR(300))) as
VARCHAR(300)), 100)

INSERT
INTO t3_inmem(c2)
VALUES(@c)

SET @i = @i + 1

END

COMMIT


SET @timems =
datediff(ms, @starttime, sysdatetime());

SELECT
‘IN-memory OLTP-based table insertion, 100000 records: ‘
+
CAST(@timems AS
VARCHAR(10))
+
‘ ms’;


–105 ms.


Checking in on productivity…

Enjoyed this article here on how to best be effective at work. 5 simple rules:

  1. To-do lists are evil. Schedule everything.
  2. Assume you’re going home at 5:30, then plan your day backwards.
  3. Make a plan for the entire week.
  4. Do very few things, but be awesome at them.
  5. Do less shallow work — focus on the deep stuff.

On my part, my data diet was a kinda-success. Today for example I horsed around for a few minutes (checking up on the Simpsons, Slate, “news” that really isn’t, etc) – which really stretched into nearly 90 minutes. But that’s the exception and I’m determined not to make it a habit. I do have a simple plan for today and I will kick it – just 2 important things I’ll keep a focus on until it’s done. Working out and a new diet (in September I didn’t even have coffee!) has also been a big boost to my energy level.

That’s it for now. Got to get back to work!

Debugging Windows applications – my walkthrough path

Recently faced an issue where a client had a memory allocation issue on one of their servers. I’m not going to deep dive into any of these, but here were some of the tools I used in tracking down the culprit:

  1. Go through Eventvwr and look at any error messages. There’s a list of error codes on MSDN.
  2. Get a process dump (full please!) using procdump. Configure with –ma –x to capture a dump on failure.
  3. In Windbg, open the crash dump and use !analyze –v. There’s an extensive set of help files on windbg.
  4. DebugDiag for crash analysis, slow performance, memory leak analysis, and performance analysis.
  5. ApplicationVerifier (appverif.exe) – for subtle programming errors. (i.e. heap corruption, incorrect handles). Since this must be run client-side, more of a dev than a production tool. This doesn’t require a process dump.
  6. Perhaps look at a self dump generation in code.
  7. Perfmon/PAL to look at memory leaks. This is for growing heaps (where memory is allocated but not deallocated), handle leaks (handles are created but not freed), and rising thread count. Memory allocation issues are very troublesome to catch and there’s a ton of third party tools out there to help – think RationalPurifier or Insure++.


In a little more detail:

  • For a crash:
    • Windbg debugger is xcopy deployable.
    • DebugDiag runs as a service, and monitors the process – if it crashes, it creates a dump.
    • Adplus – this is a command line tool you can set with –crash –p{processID}
  • For a hung process:
    • Task Manager (right mouse click to create a crash dump)
    • DebugDiag (process tab, rt-mouse click, create full user dump)
    • Adplus –hang –p{pid}
  • For a memory leak:
    • CLR memory profiler
    • DebugDiag (our Swiss army knife!) – leak track, rule and user dump
    • Umdh (old school – command line)
    • For .NET, there’s sos.dll and psscor4.dll – these are debugger extensions to analyze .NET dump stacks.

Perfmon and PAL notes

PAL is a tool (available on CodePlex –it’s open source) that generates an HTML report that charts performance counters generated from PerfMon and throws alerts when they’re exceeded. We’re not talking about anything obtrusive here – just a little VBScript GUI on top of Powershell to generate a nice-looking graphical UI. Its really sweet and can save you a ton of time in figuring out what the heck is going wrong when your server isn’t working properly. I ran it this morning on my underpowered little laptop and found a lot of issues with context switching for example:

Simple Overview:

  1. Download PAL and the separate Chart Controls for .NET 3.5 and install.
  2. Open up PAL and in the Threshold File tab export a template. Go ahead and view the XML file you generate in any text editor and view the counters. See, no magic!
  3. Open up Perfmon and create a new user defined data collector set. Import the file you created in #2. Run it in perfmon for at least 10-30 minutes.
  4. Go back to PAL and select the .blg file you just generated in #3 in the Counter Log tab. Click Next and then – last tab – generate your awesome HTML file, complete with charts and RYG indicators.


Long and Boring:

To run these tools, use the following steps:

  1. Download PAL from CodePlex and run the MSI package.
  2. Install the Chart Controls for .NET Framework 3.5 – there’s a link in the main codeplex page here.
  3. Now run PAL. Choose the default template:


    All done with that? Good.


    In the Threshold File page notice the long list of threshold files you can choose from – anything from BizTalk to System Overview (good if you have no specific match) to ASP.NET to SQL Server 2008R2 etc. BEFORE you do this go to the Questions tab and make sure its set properly for your OS/# of CPU’s / available memory etc. Then go back to Threshold and select Export to Perfmon Template File.


    And click on the Export to Perfmon template file and enter a nice-sounding name to create a perfmon profile template (BLG) onto your desktop. You’ll be using this next.


  4. Now open up Perfmon and expand the Data Collector Sets node, and select User Defined, and create a new data set.

Give it a name:

You’ll see the following – use the Browse button to select your template:

… and run it. Give it a healthy 10 minutes or even longer – you won’t stress your system. Then reenter PAL.


The tab above is worth a mention. Just select AUTO. You really don’t want to have it as more than that – a little too coarse of a grain to capture issues there – and anything less is WAY too fine. Trust me, with the number of counters we’re capturing, even with a very modest set it took PAL almost 12 minutes to finish compiling its report. 30 seconds is fine!


Everything else leave as is. I like to set the PAL tool so it Executes and Restarts:


There’s volumes of information here – a wealth of diagnostic information. Best part is, there’s KB links right there to point you to where to go. No more wondering what counters to pick, or what the values mean – it’s there and displayed, over time, in an easy to digest format. You can run perfmon just fine on any production environment with one caveat – BE CAREFUL about the length of time you’re running perfmon, usually 10-30 minutes is fine, although I’ve run it overnight – and don’t change it to something crazy like every second or something. Use the AUTO setting (which is 30 seconds). Changing this value to something unreasonable can bottom out your servers in no time flat, and makes root cause analysis harder.

There’s another tool out there called Server Performance Advisor – it analyzes both perfmon logs and Event Tracing for Windows. It’s best for analyzing short term performance problems; PAL is best for covering long periods of time.


Helpful links:

Give Yourself Nine Months to Fail.

(Note – this is a Greatest Hits posting from my previous blog. Enjoy!)

Babies aren’t born in one month.

Implementing Scrum Means Making Mistakes. Lots and Lots of Mistakes.

When I started on at my current employer – even after nine months as a team lead – I had very little to boast about by way of making change. I remember hearing a presentation from another manager that had the title, “Keeping The Lights On” – WOW! – And honestly that was how I felt about my job. Keeping the lights on, reacting to events – not getting ahead of them, and not able to control them. I was very disconnected from the work my team was doing. This changed as we moved out developers that were not contributing to the team and not being transparent about their work; and, as we got new projects coming in, I could cherrypick the fun ones and start participating in writing specfications and deploying solutions. Beyond taking on new work, though, Agile is the biggest reason why I’m still around. Without it, I’d be like the manager at my previous company – completely isolated from the daily work my team is doing, trying to defend our existence without the facts I need to prove that we’re delivering value.

I started thinking about my company – which seems to love mountains – and how every company’s definition of Agile is a little different. At the keynote I met an old compatriot – we had worked on a project together that was a failed Agile project. Everyone hated the DSU’s, which were 15+ minutes long, there was no target in sight since releases were pushed out to “never”, we went through constant rewrites as the technical team constantly refactored working code to get it “perfect”… it was a case study in how to do Agile wrong. After 18 months of development, they had to scrap the entire project and outsourced it to an offshore team – not one line of code ever saw the light of day. I believe a big reason why we failed was, we tried to change everything at once – and the team never gelled or considered itself invested in the outcome. In contrast, almost by accident, by doing things step by step – and rolling back when things weren’t working – we were successful in my current assignment. The path below took almost two years to implement, step by step – but it was done with the team setting the pace, and almost by accident we reached our goals.

I started out by talking about the fears I felt after a few months on the job. Overwhelmed, disconnected. I said, “I feel at times like I wasn’t as much in control as I need to be. I wasn’t in command of all the facts I need to support my case. I didn’t have enough visibility of what’s going on across the organization. I wasn’t giving my team all the tools and resources they need to thrive. And I wasn’t providing enough proof of delivering value aligned with what my company’s priorities are.”